

The Spectrum-NET UI provides a dashboard view of the RF environment within the mobile network. Spectrum-NET users have access to powerful insights into the RAN and can view a comparative analysis across:
AI INSIGHTS
Automated ML-Driven Analysis of Radio Access Networks
Spectrum-NET delivers valuable AI insights that enable operators to quickly solve complex problems and unlock the full potential of their network.
We’re changing the way operators improve  spectral efficiency with continuous AI-driven automated analysis, offering fresh insights and rapid results.
AI INSIGHTS
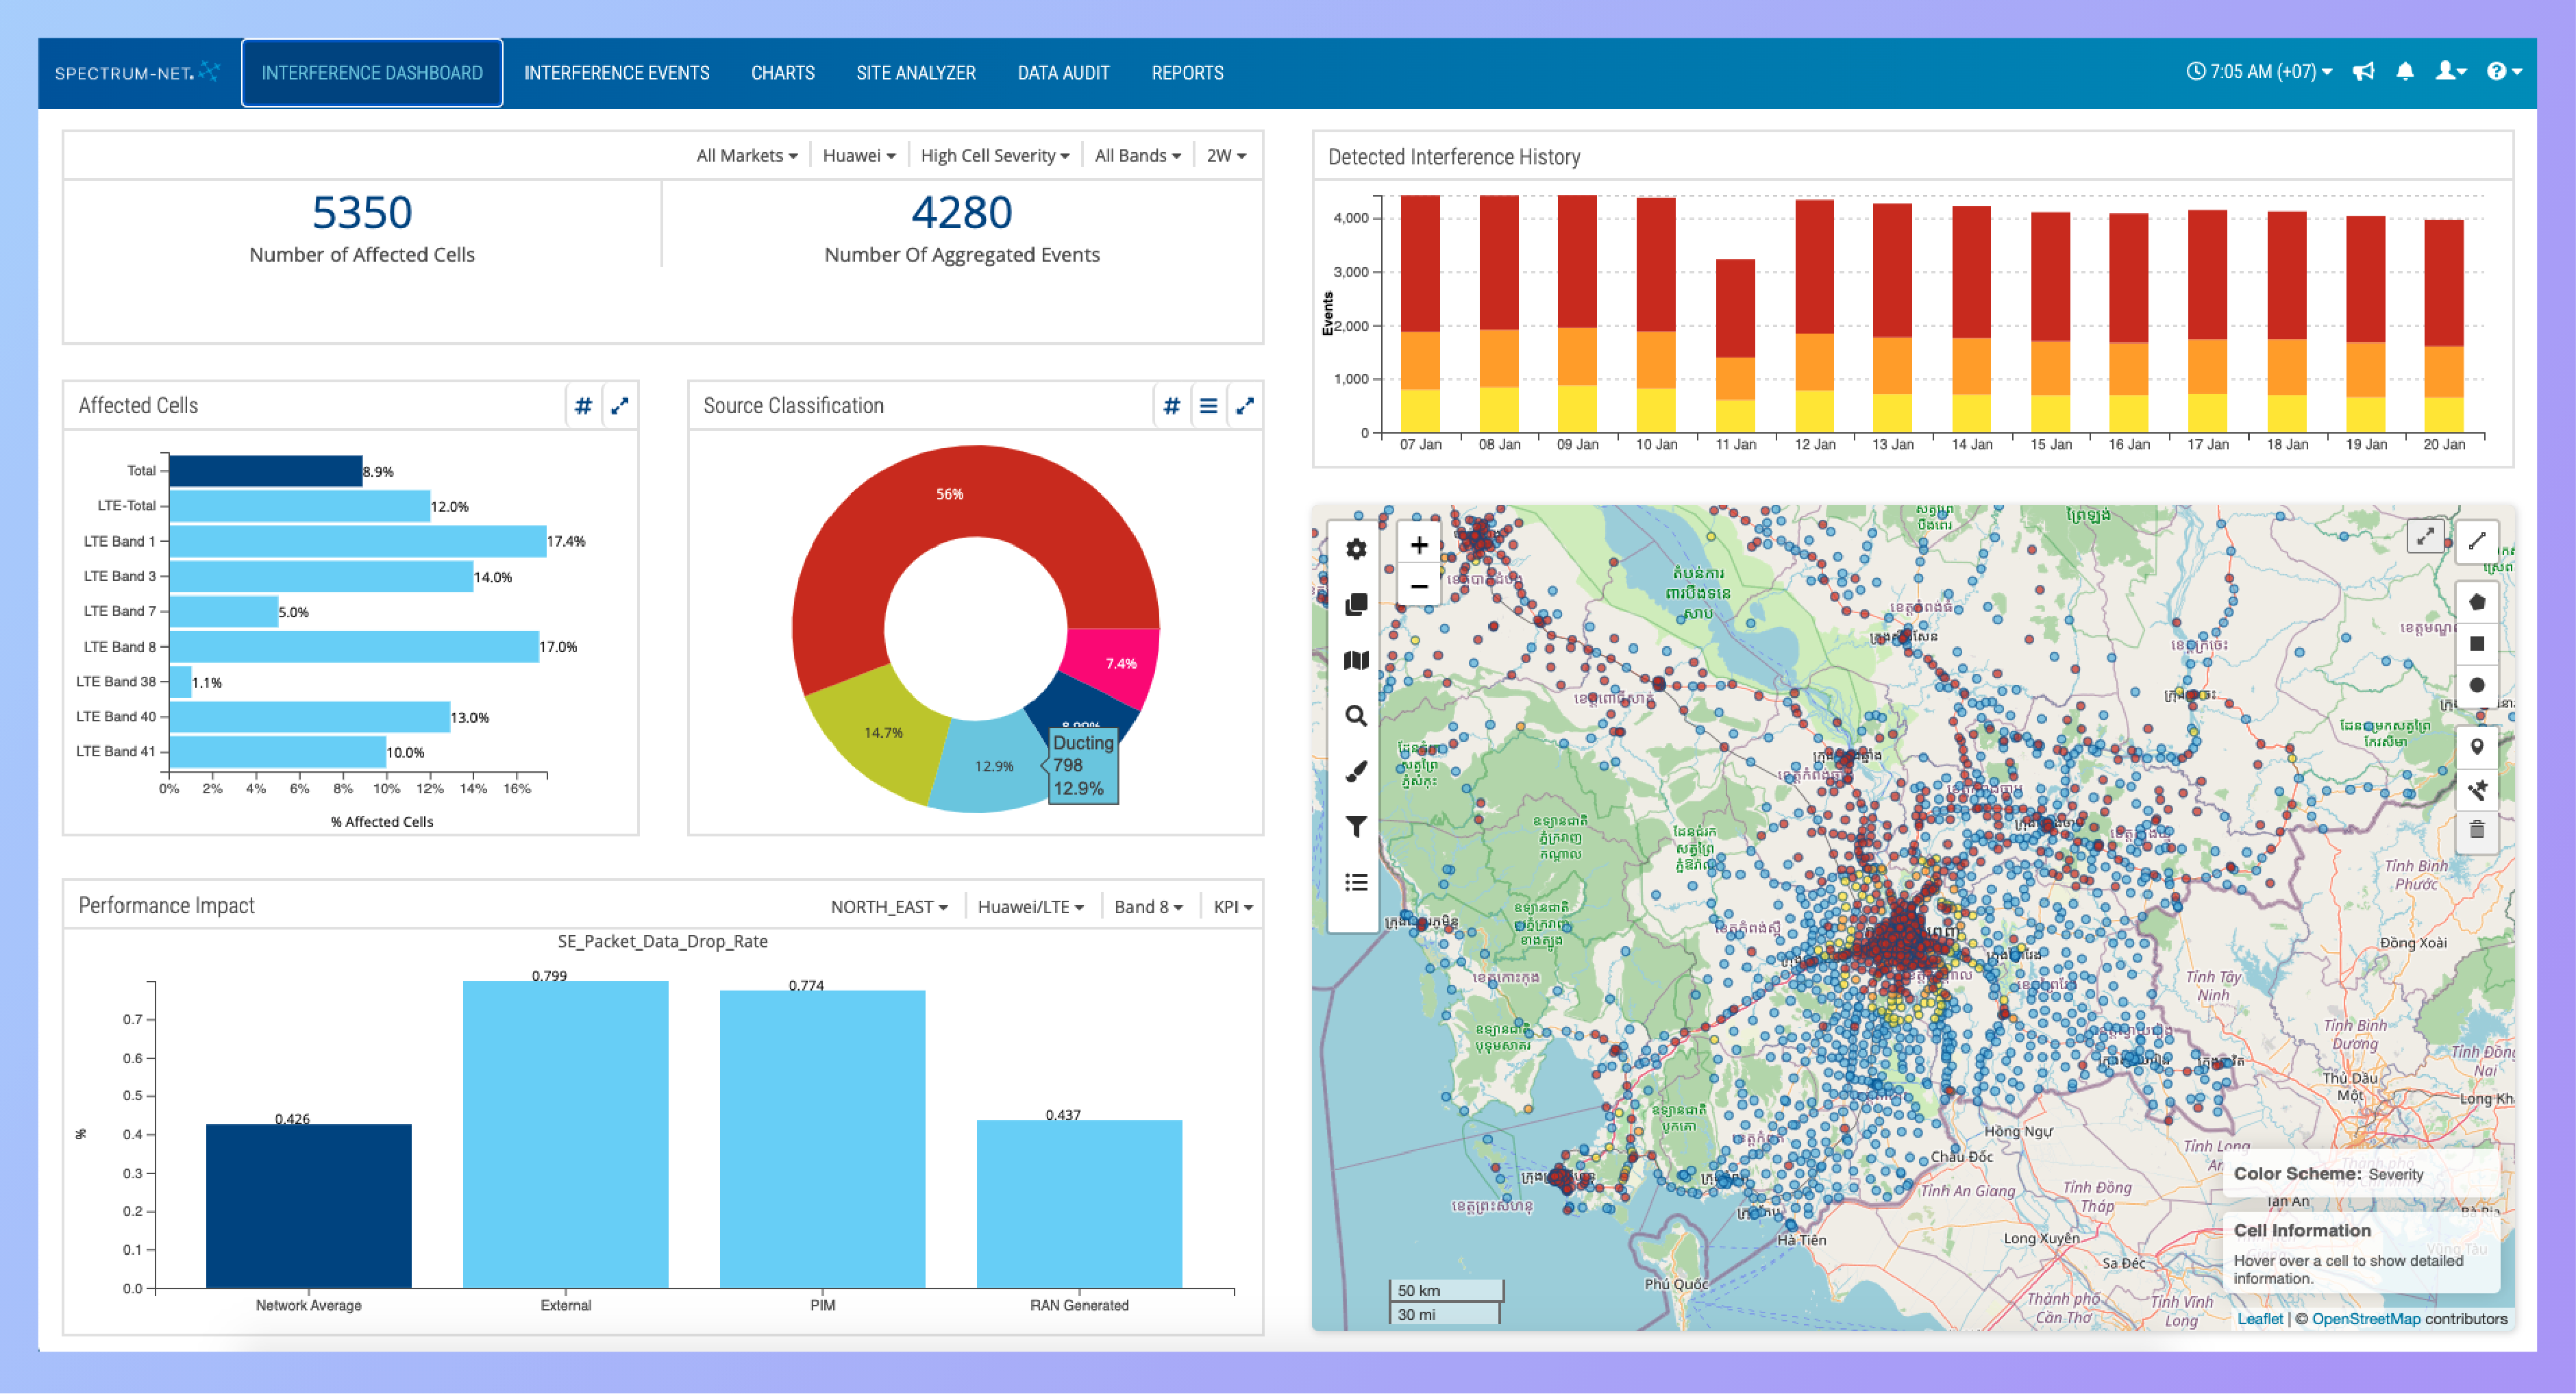
RF Dashboard: Key Insights into the RAN
- Root Cause of Issues
- Severity of Issues
- RAN Vendors
- RF Bands
- The KPI Impact of Issues
- Trending Analysis
- Market-Level and Nationwide Network Views
AI INSIGHTS
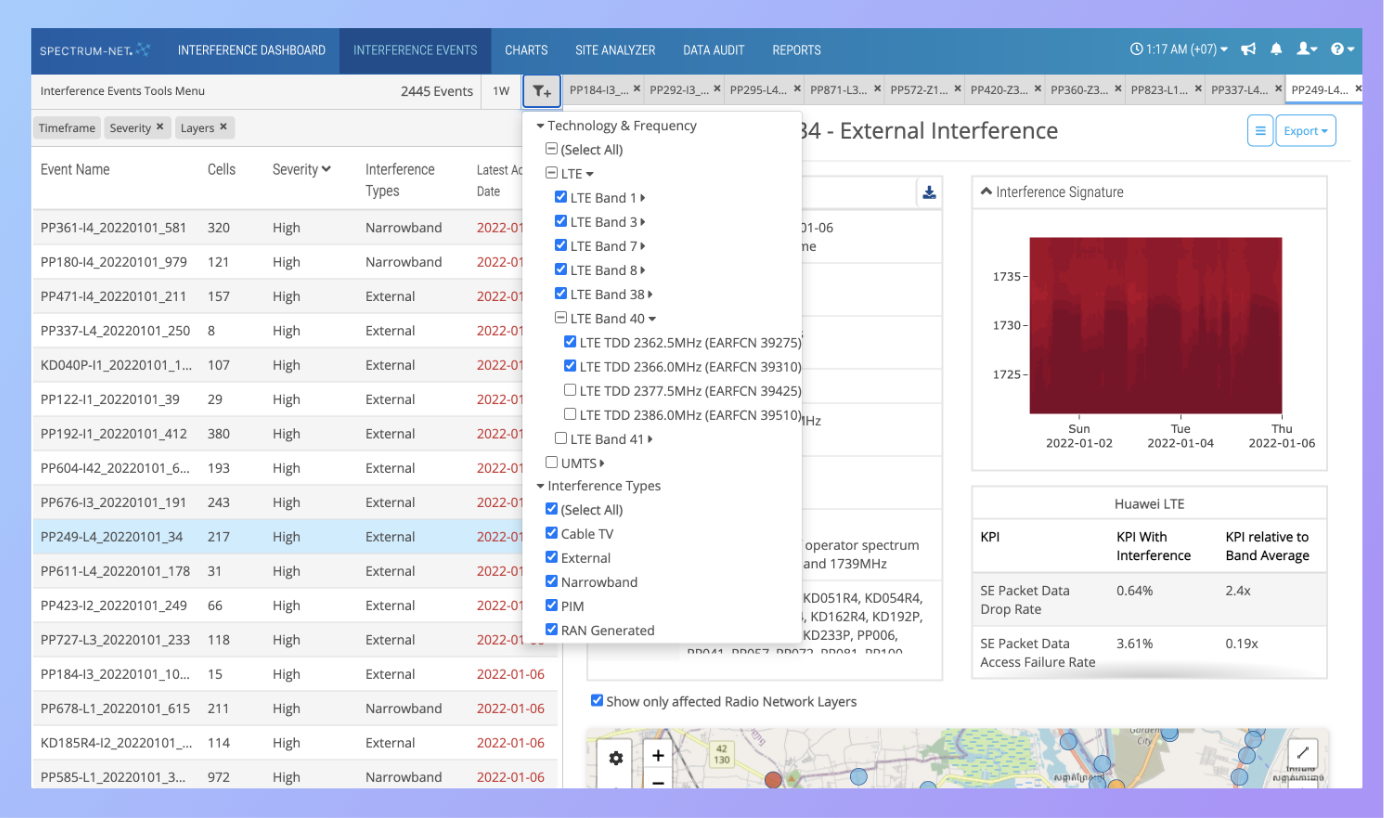
Intuitive Navigation of Actionable RF Events
With Spectrum-NET, users intuitively navigate events affecting their network:
- Filter by RF interference source type, RF band, RF layers, RAN technology, RAN vendor, RF interference severity, activity percentage, and market.
- Sort by RF interference severity, number of affected cells, and KPI impact.
- Search events by site name and cell name.
- View detailed information of each event including frequency/temporal characteristics, source location, source classification, impacted cell/sites, performance charts, additional information specific to the interference type and the KPI impact of the interference event.
AI INSIGHTS
RF Event Reporting
Users can export customizable reports on-demand directly from the Navigator View for the current selection of interference events in PowerPoint (.pptx) or Excel (.xlsx) format. Reports can be generated for each interference event, including interference severity, KPI impact, cells impacted and interference characteristics.
The scheduling options allow the user to optionally create a scheduled report for the selected events. Reports can be scheduled daily, for specific days of the week, etc. Once generated, the reports can be automatically emailed or downloaded from the Reports tab.
The Spectrum Analyzer Configuration File in .json format can be exported for each external RF interference event. The files contain information that can be used by a spectrum analyzer to configure its center frequency, bandwidth and markers, and show the location probability heatmap on the spectrum analyzer screen.
Ready to see Spectrum-NET in action?
Learn how the world’s leading mobile operators are using Spectrum-NET to drive RF interference mitigation, improve network performance, and maximize spectral efficiency.
Request Network Analysis